How to Use
Home Page
Streams Gauge
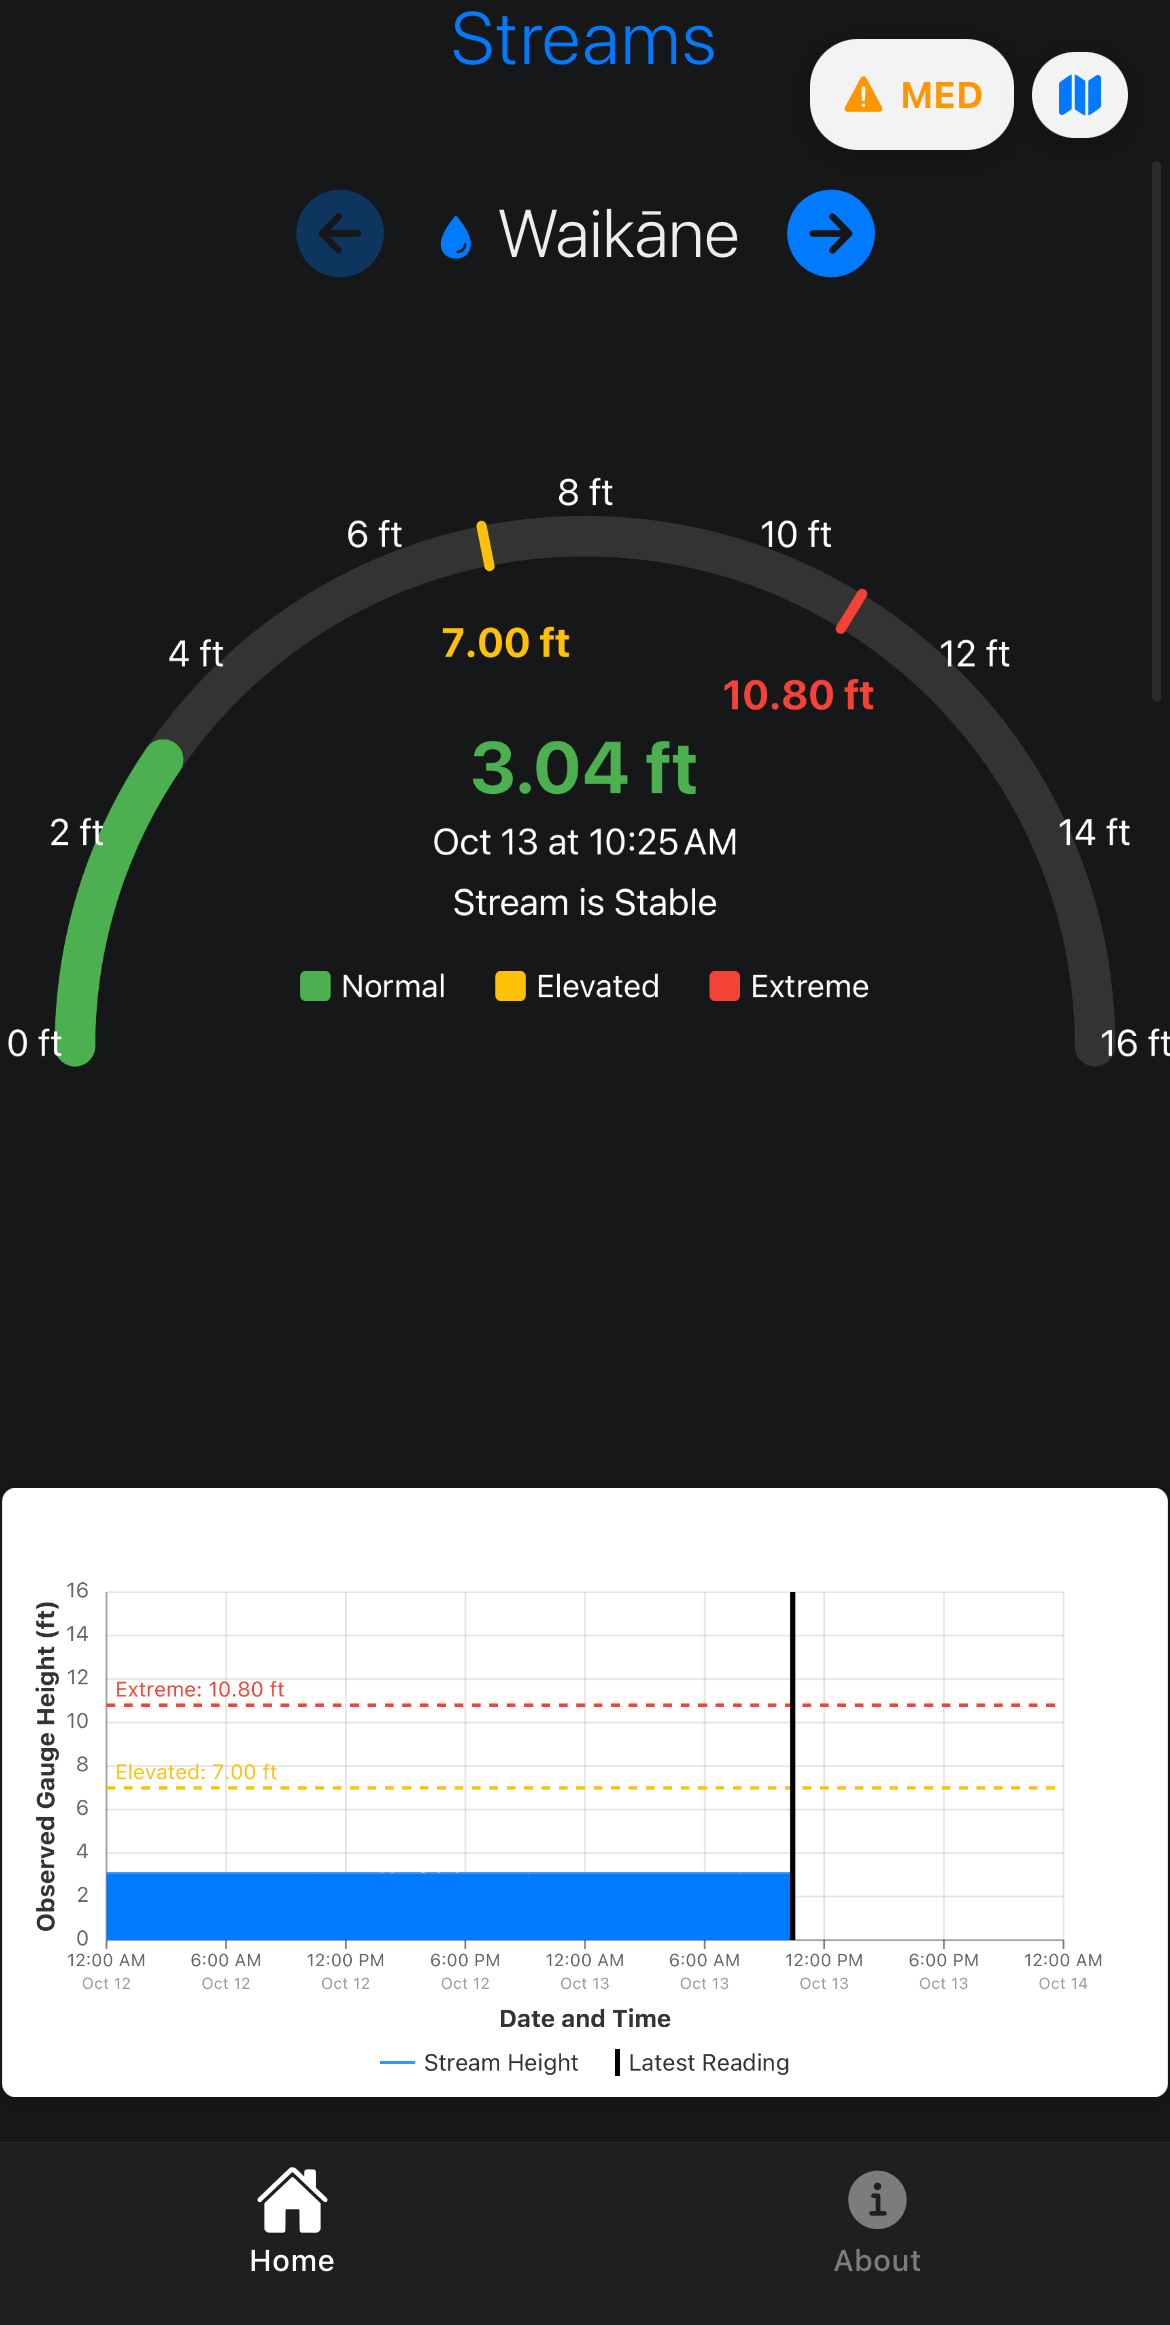
This is the gauge for Waikane streams. The gauge shows the height of the streams and is color coded based on the extremity of height. Below you can find the graph that shows the height from 12:00 AM from the previous day to 12:00 AM, the next day.
Tide Gauge
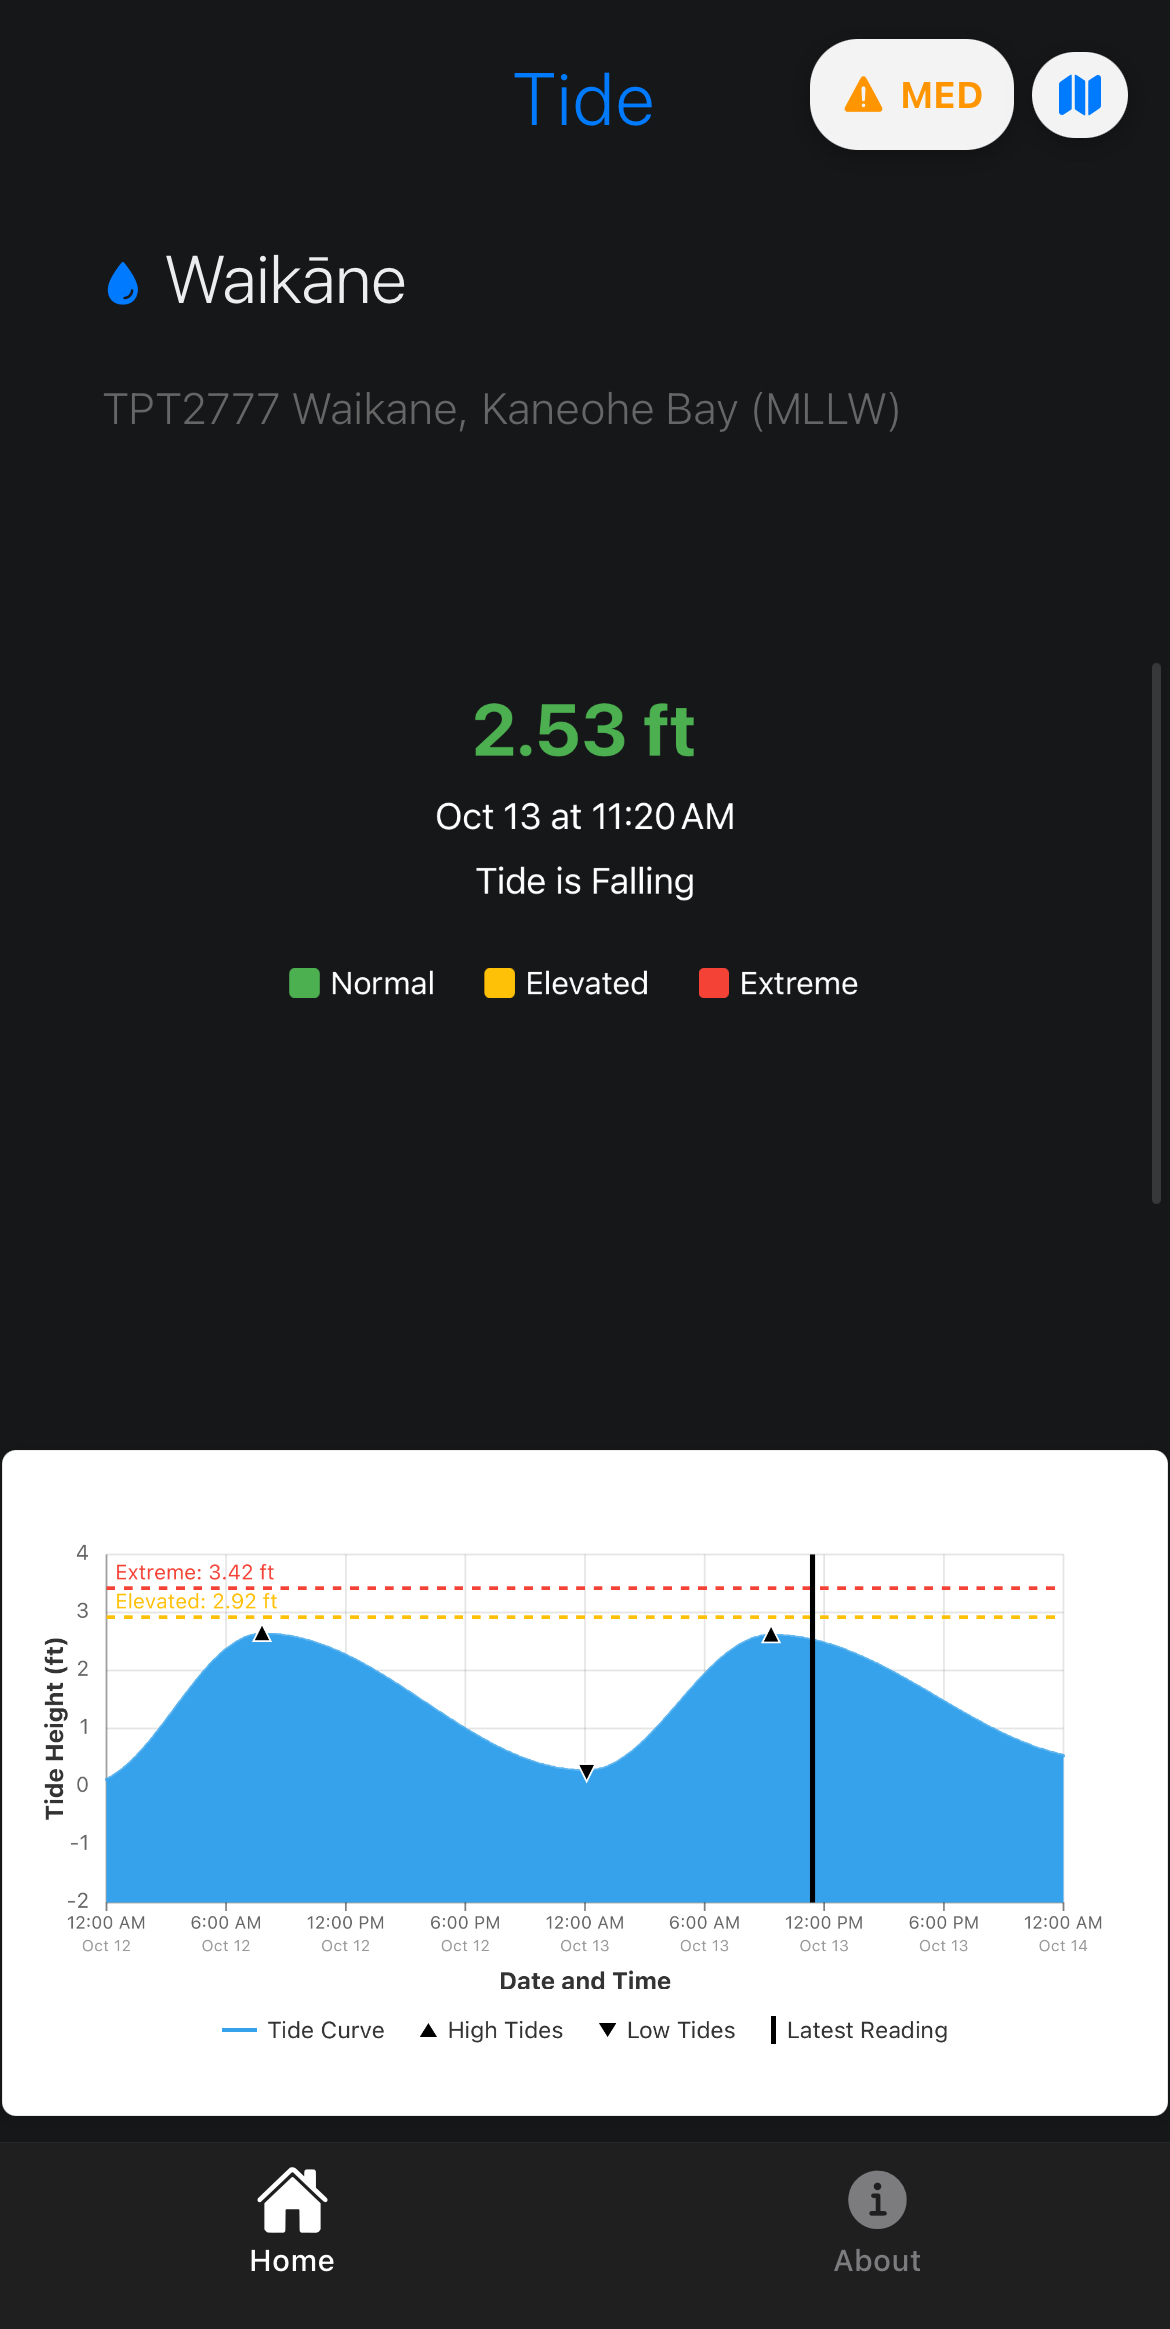
Waikane tide data is reported back through text and a graph. The graph reports data from 12AM from the previous day to 12AM the next day.
Rainfall Gauge
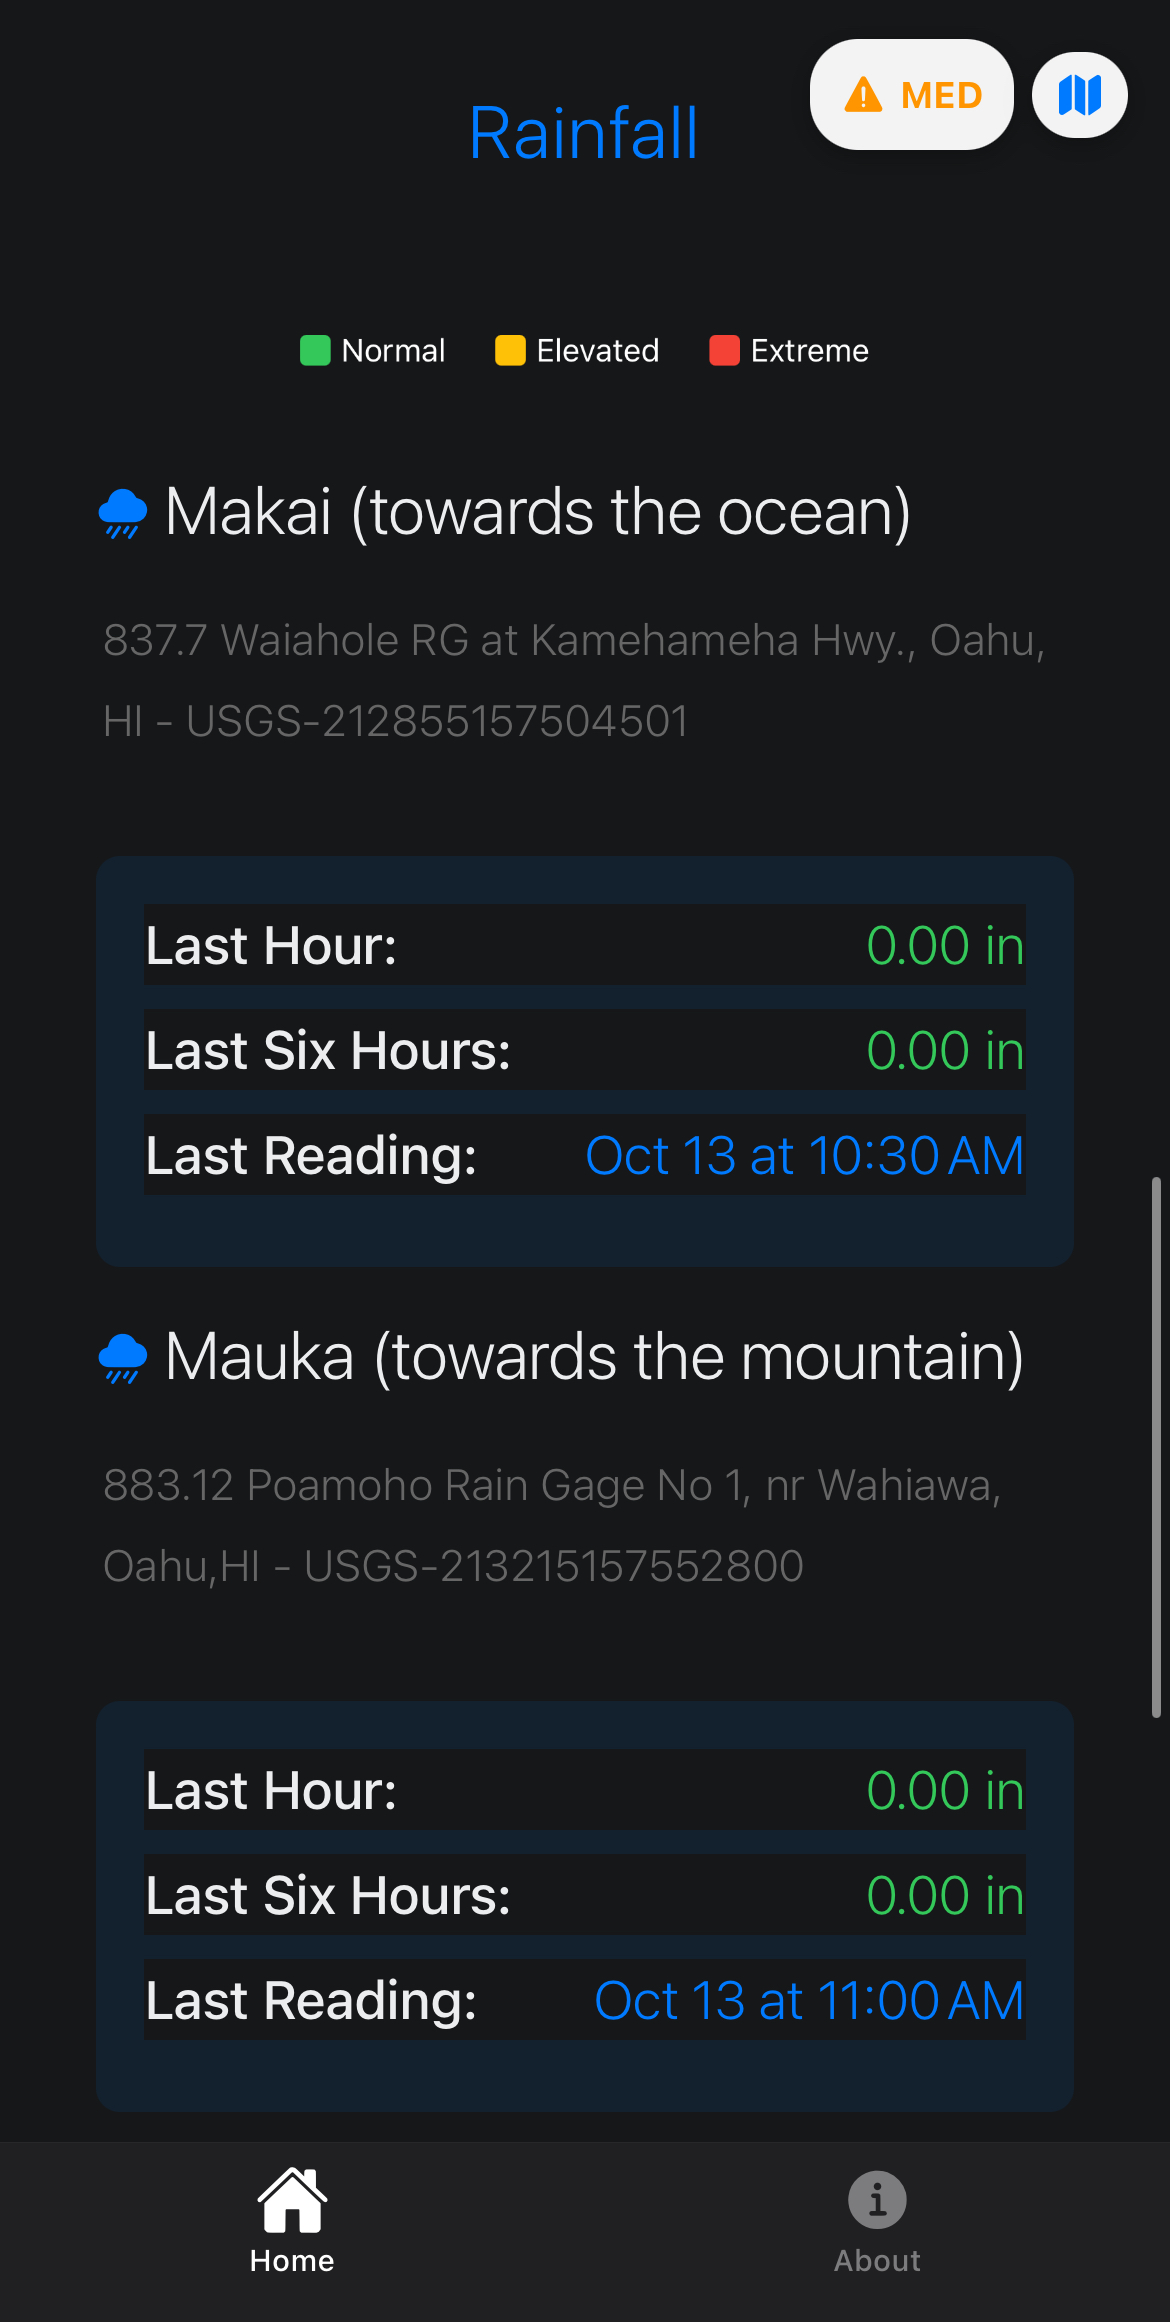
Makai and Makai rainfall data reported in the table that displays the data from the last hour, last six hours, and when the data was last updated.
Weather
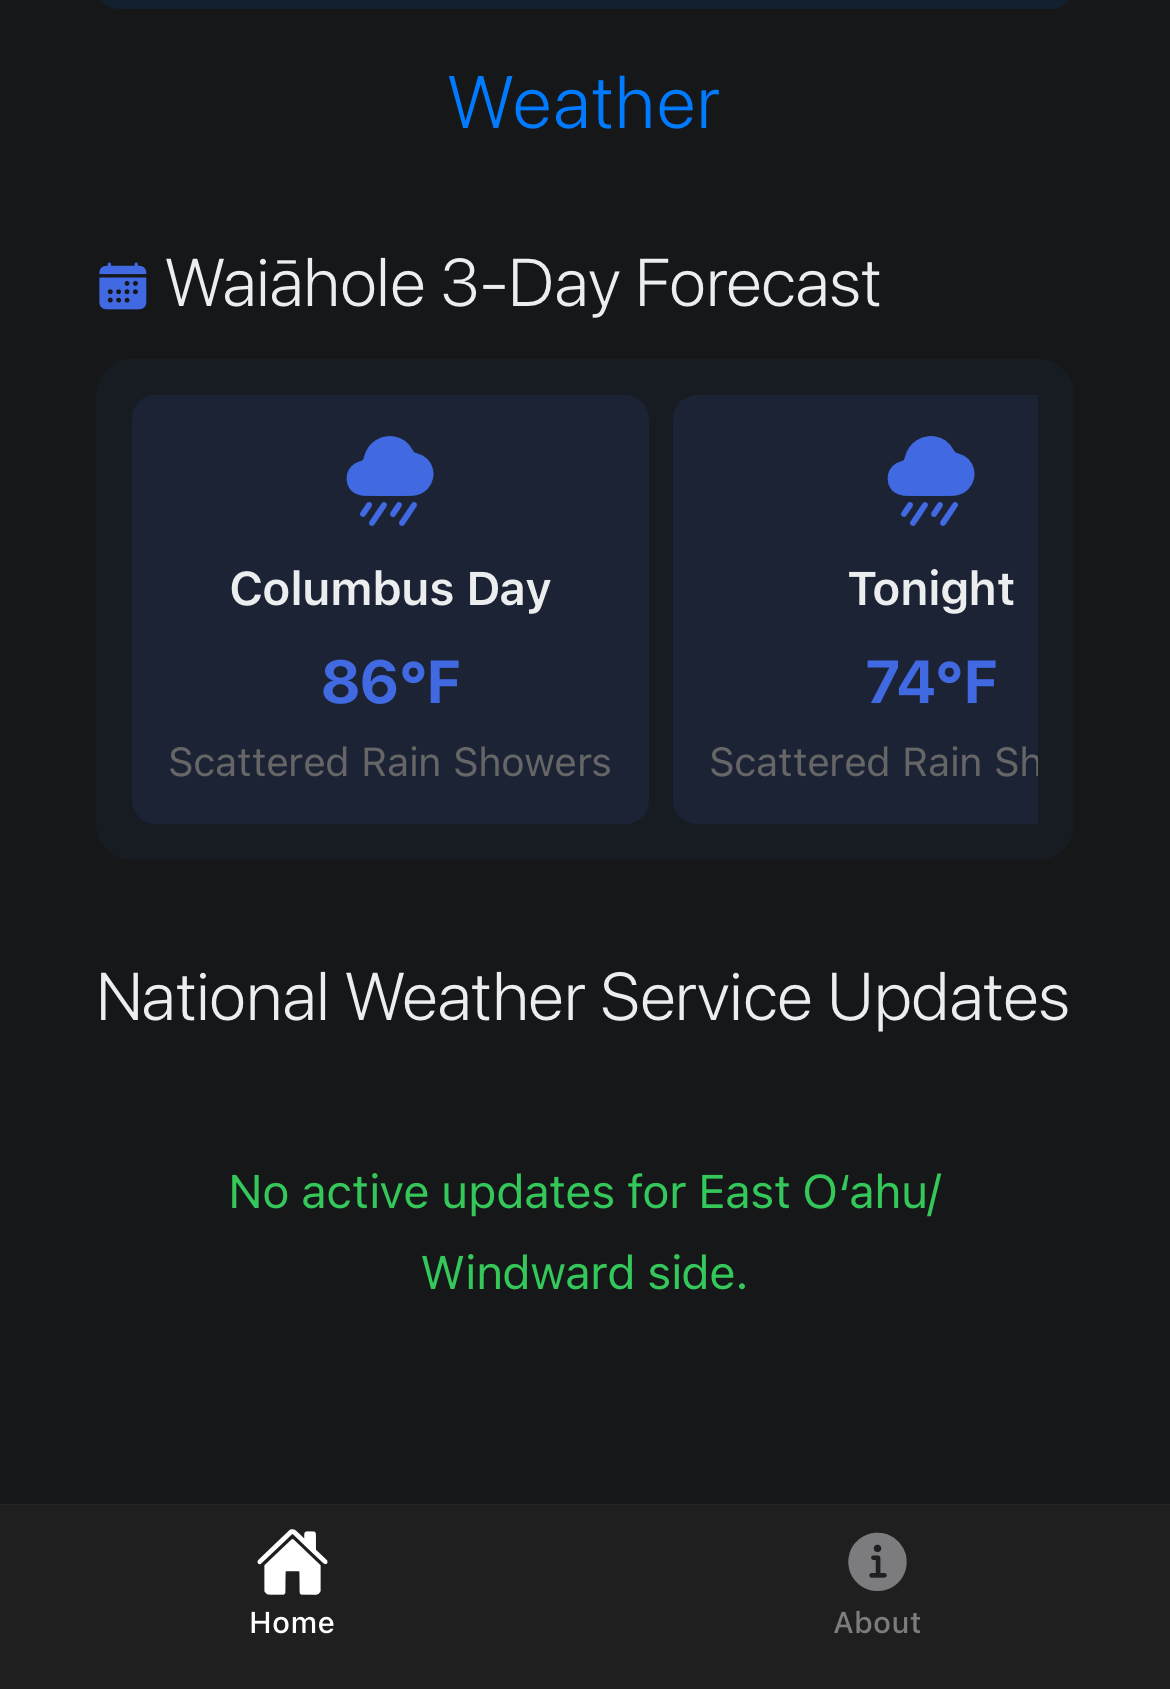
At the bottom of the home page is a 3 day weather forecast for Windward with data taken from the National Weather Service.
About Page
App Info and Methods
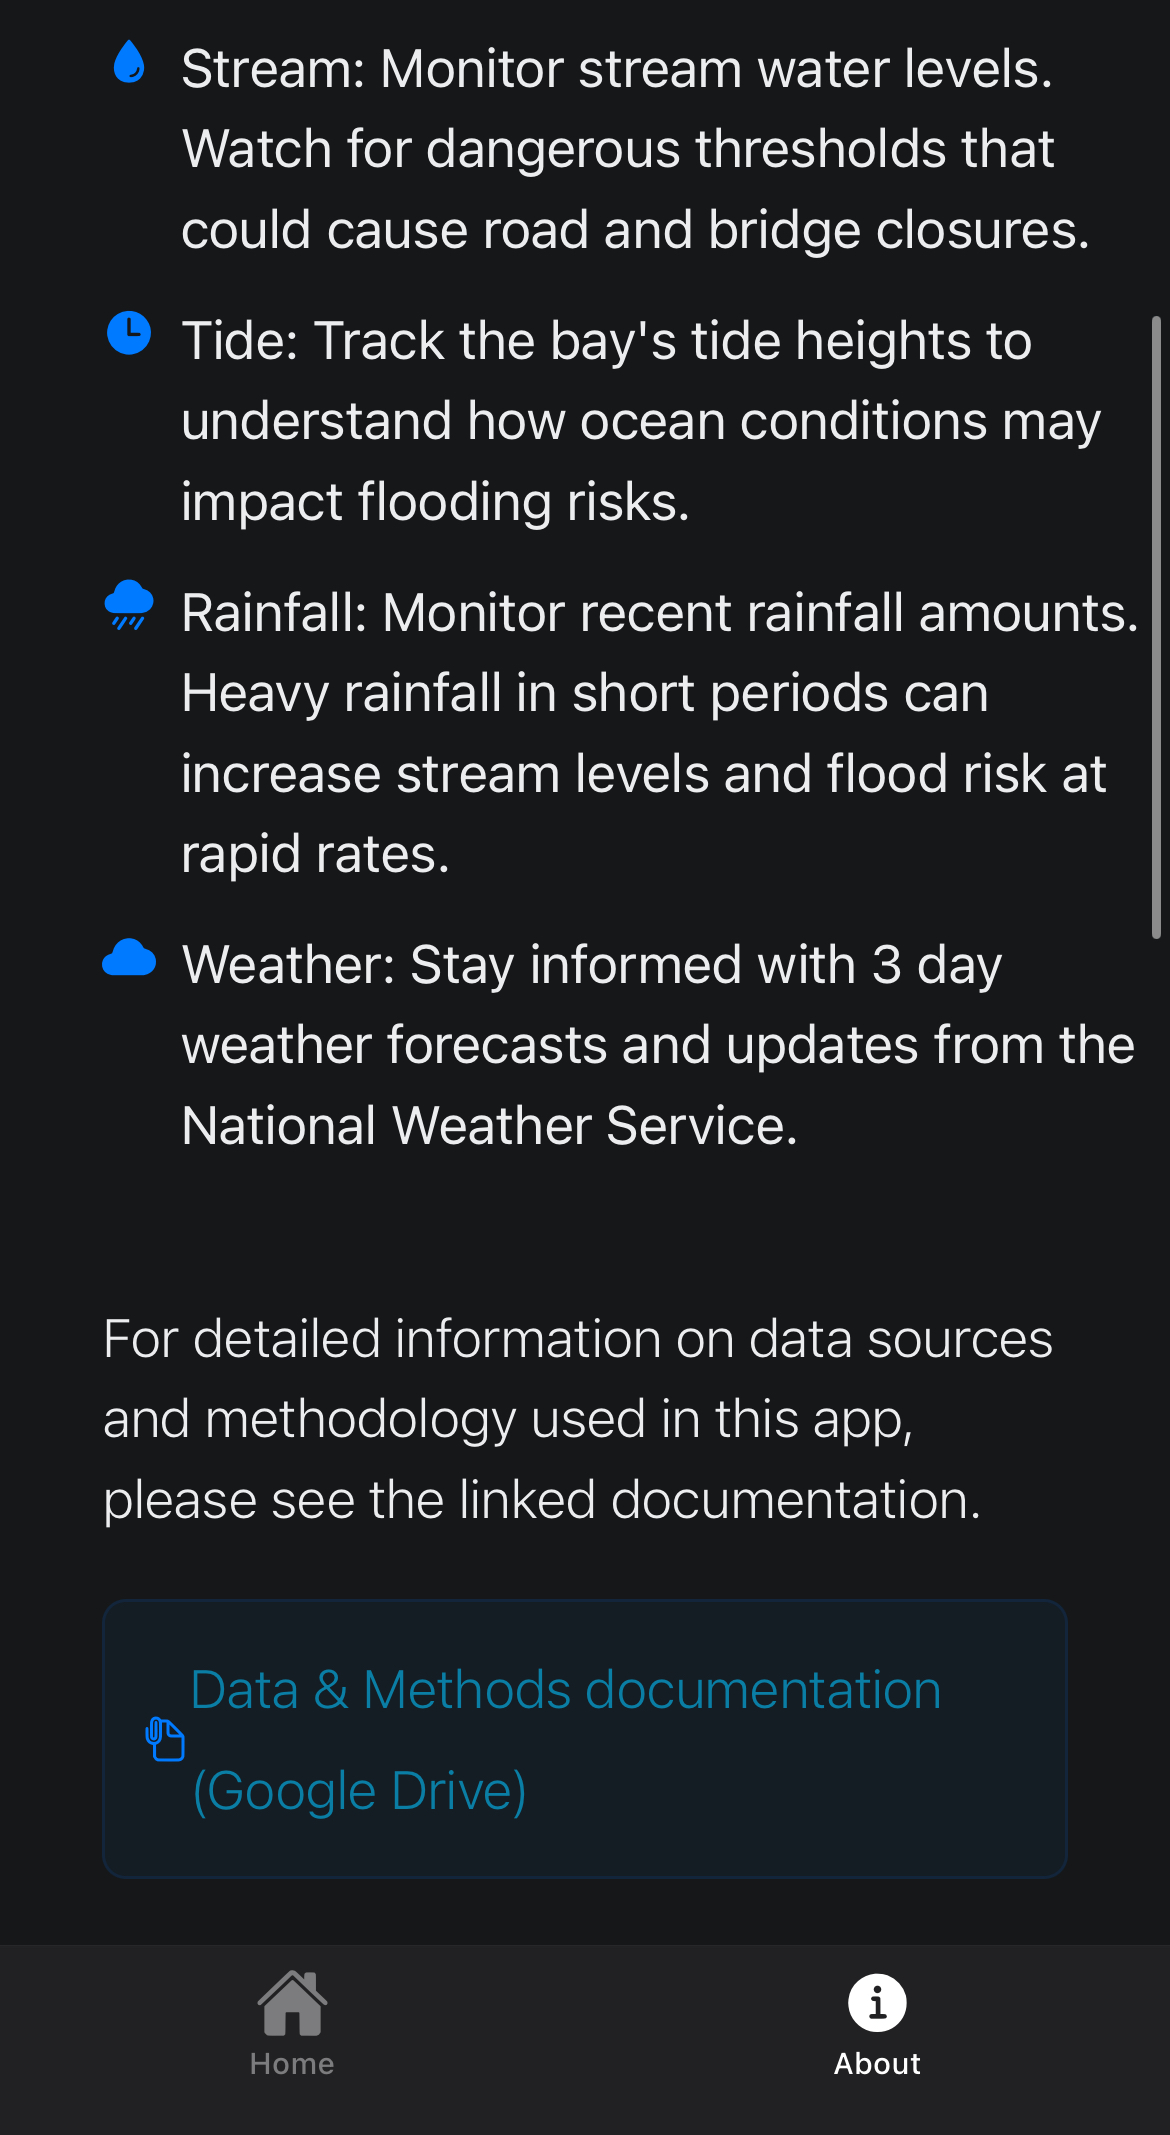
A short summary for each section on the home page. More info for the methods and data collections can be found at Data and Methods.
Contact and Feedback
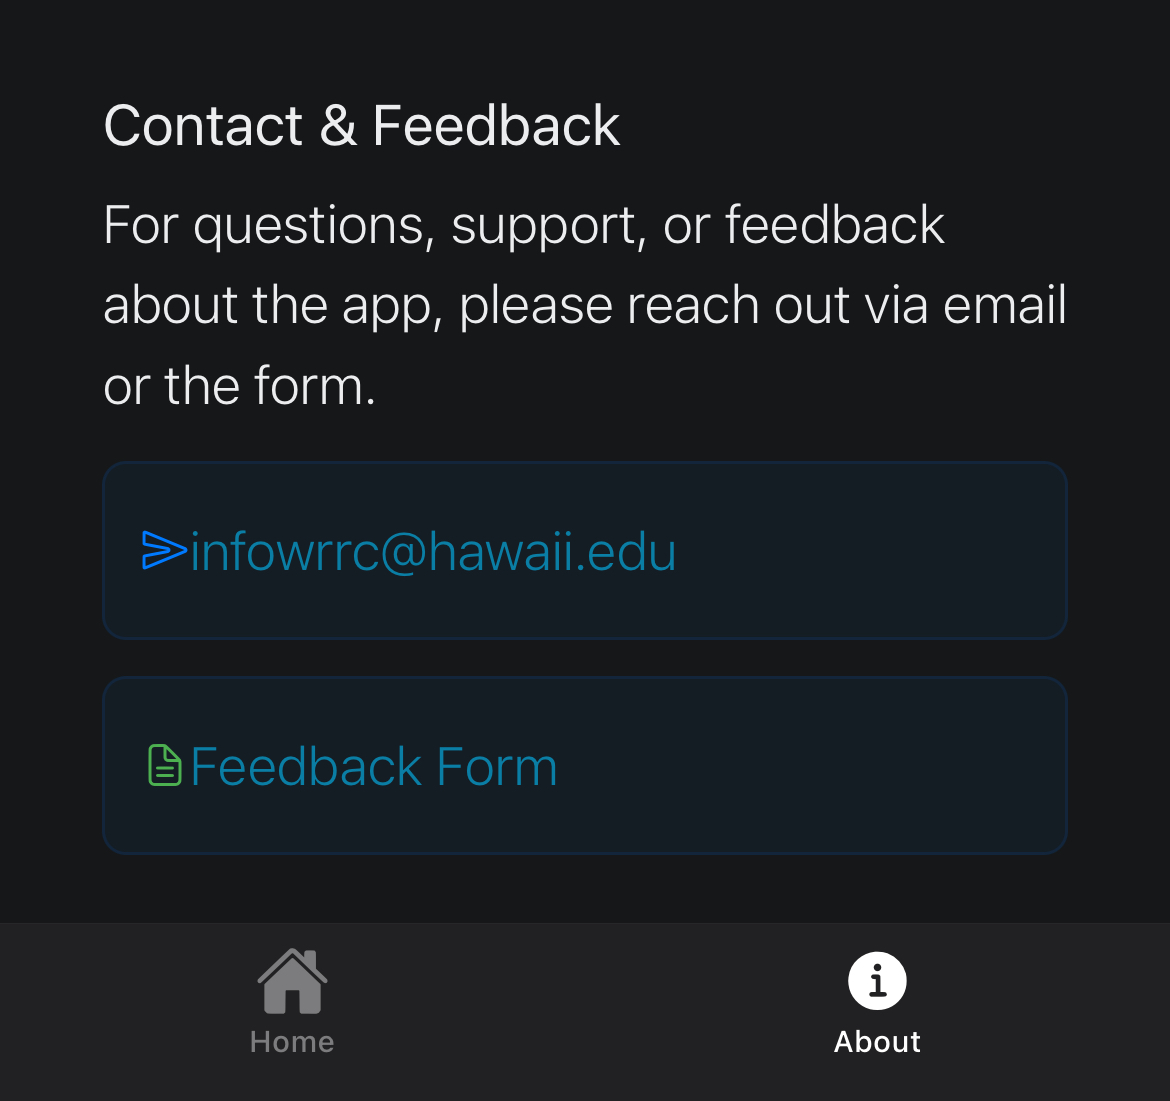
Contact and feedback can be given via email (infowrrc@hawaii.edu).
Disclaimer
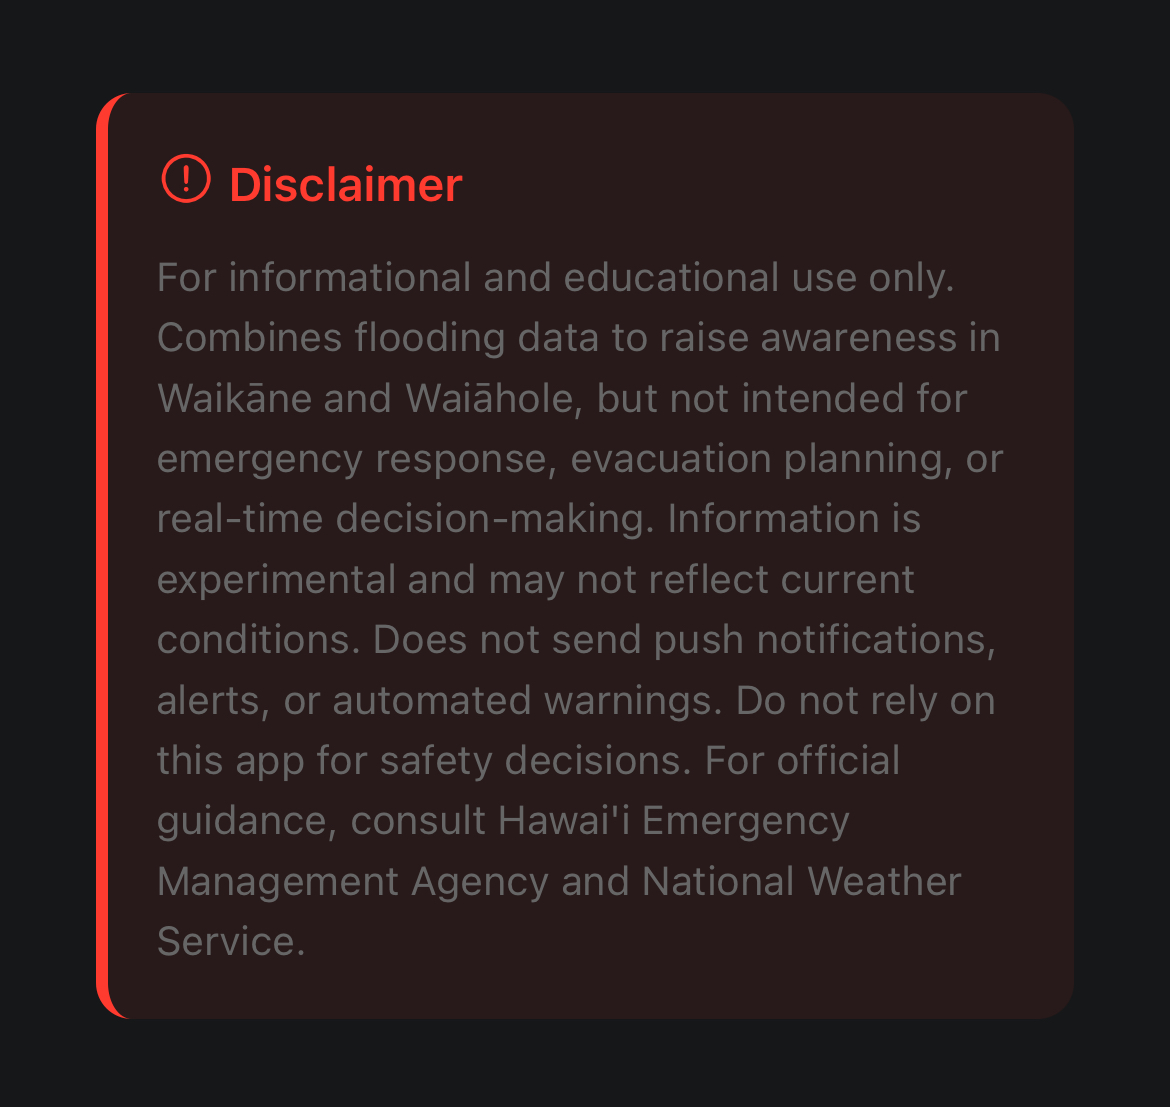
Disclaimer
Emergency Contacts
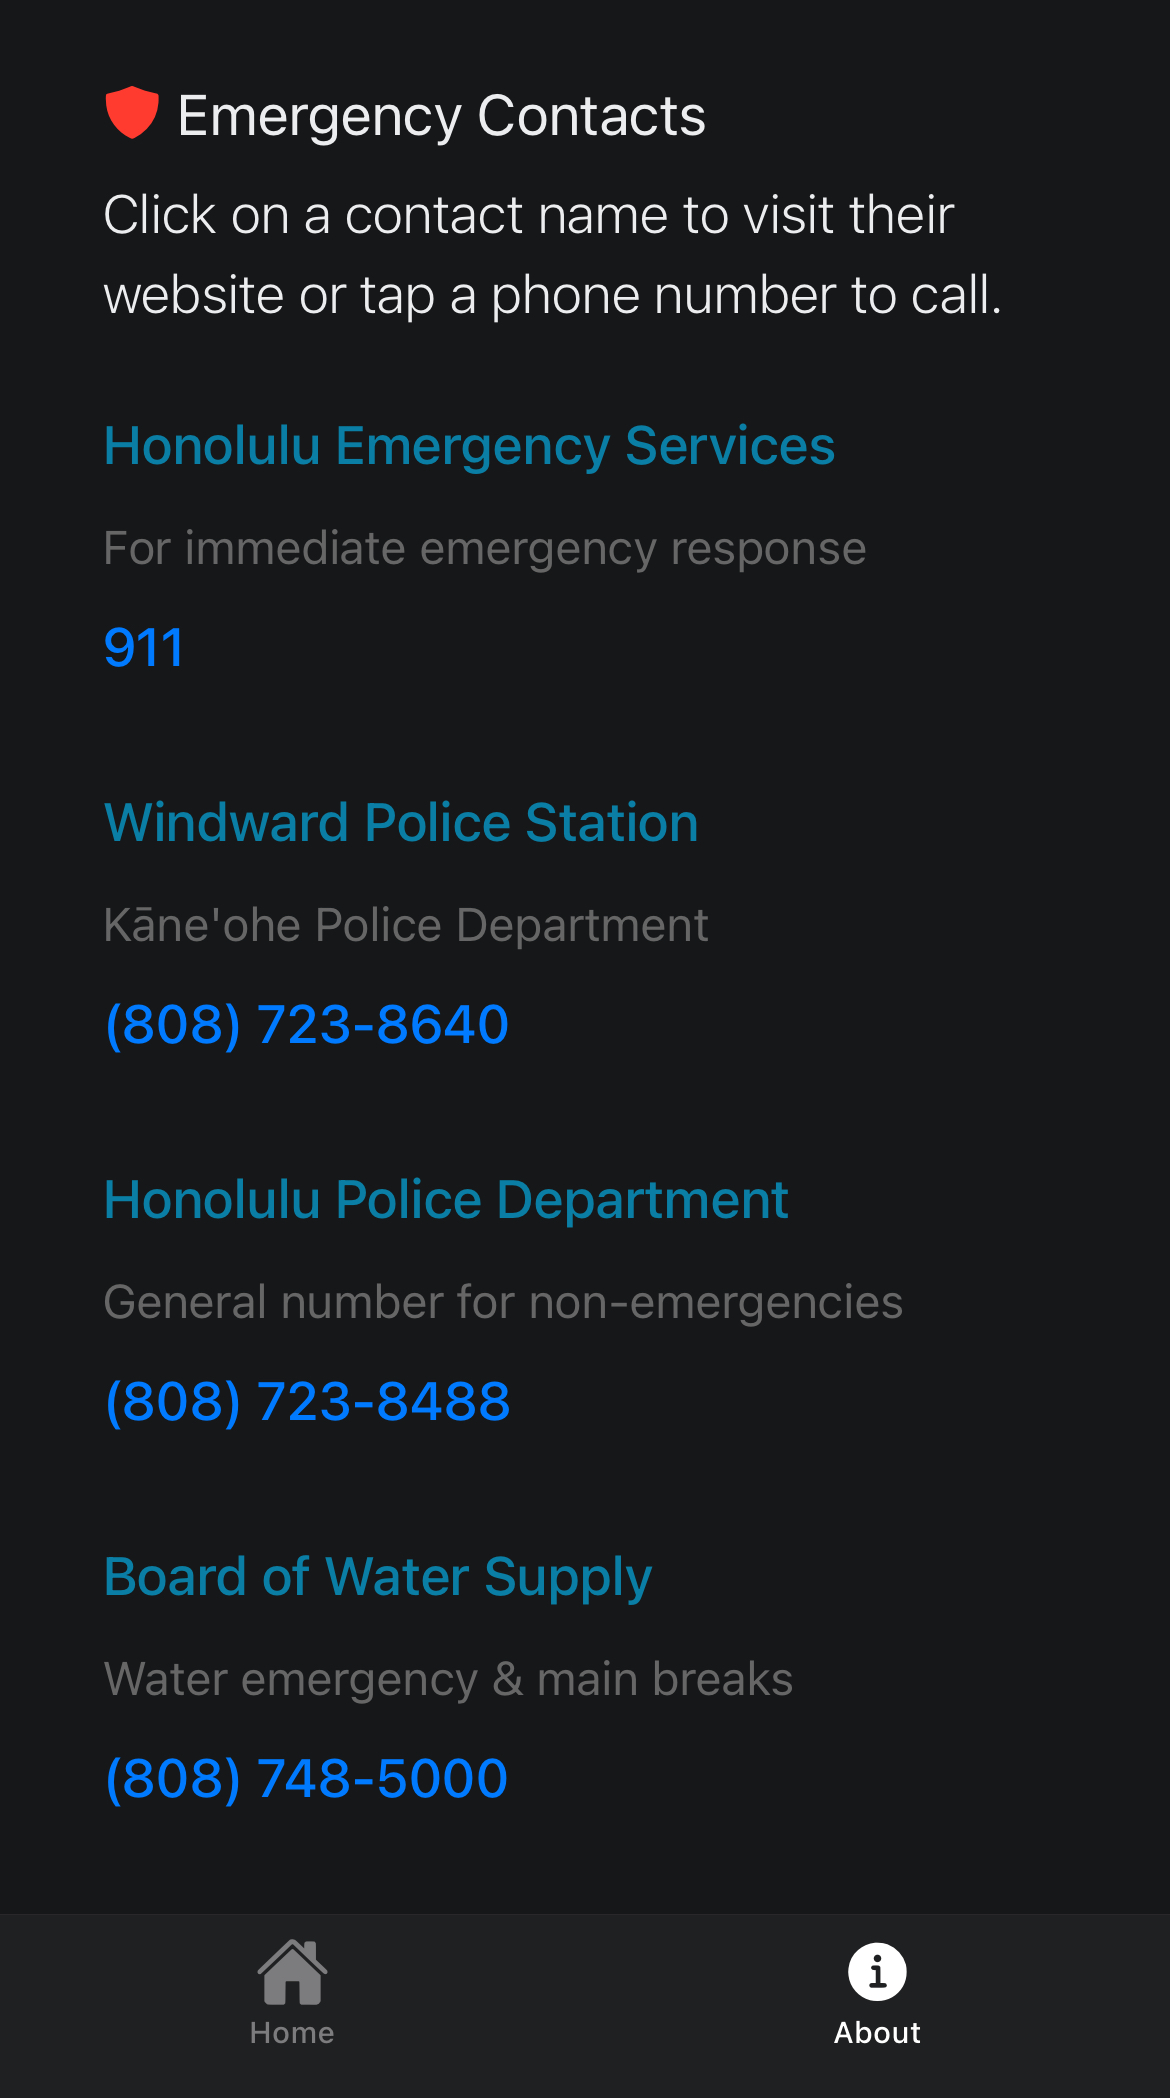
At the bottom of the about page is the numbers of emergency services.
Popup Features
Popup Buttons
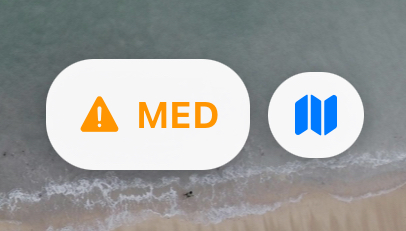
These buttons can be found on the top right corner of your screen, which includes the flood risk and a map of the Windward side.
Map
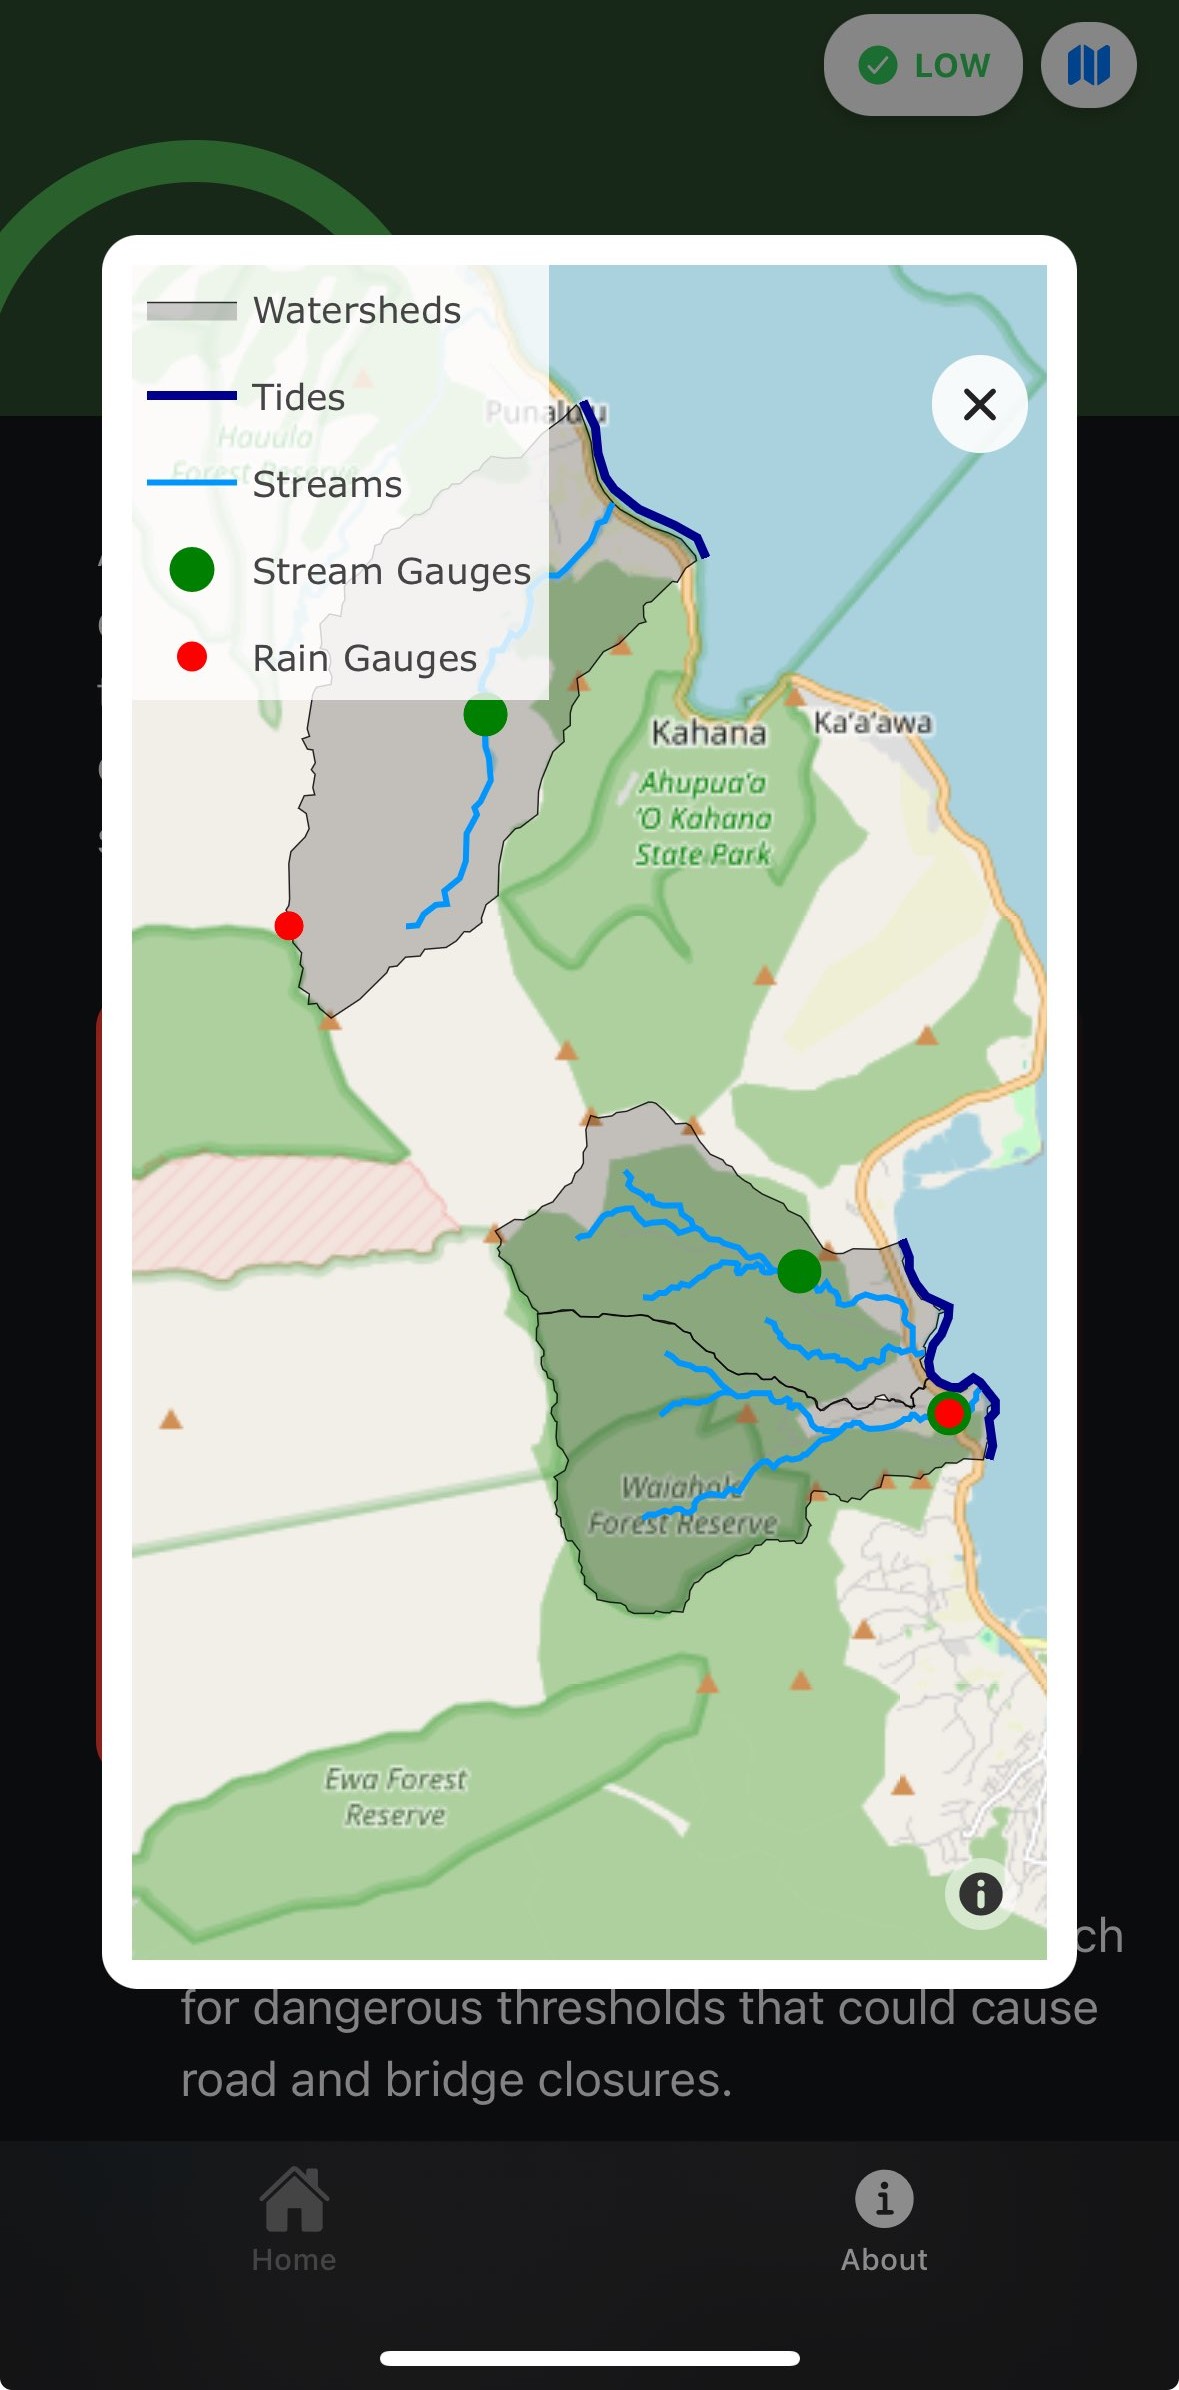
Clicking the map icon opens a map that shows a Windward map with streams, gauges, and watersheds marked.
Flood Risk
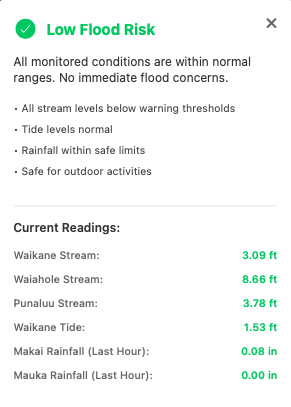
Clicking the flood risk icon opens a window with the summary of current readings from the last hour.